Sonoma County Demographic and Poverty Profile
Date Collected – 1/1/21
Download PDF Version Here
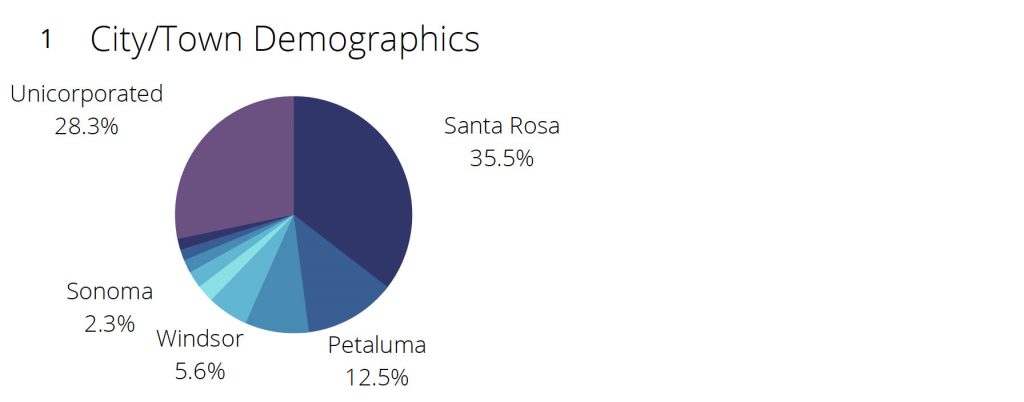
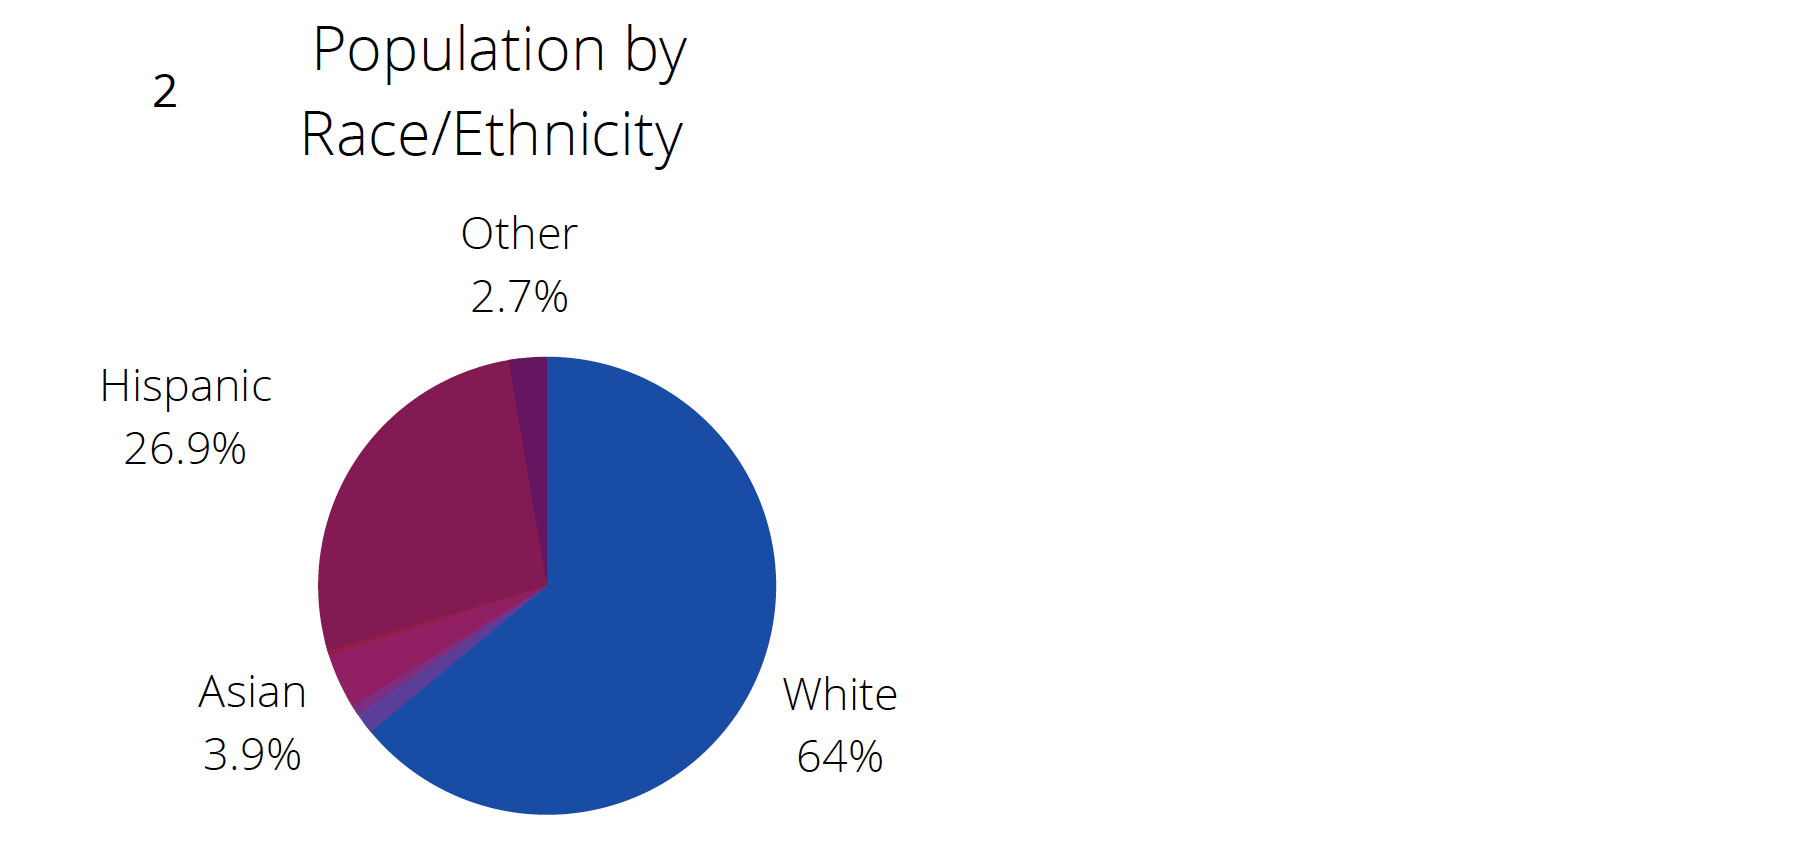
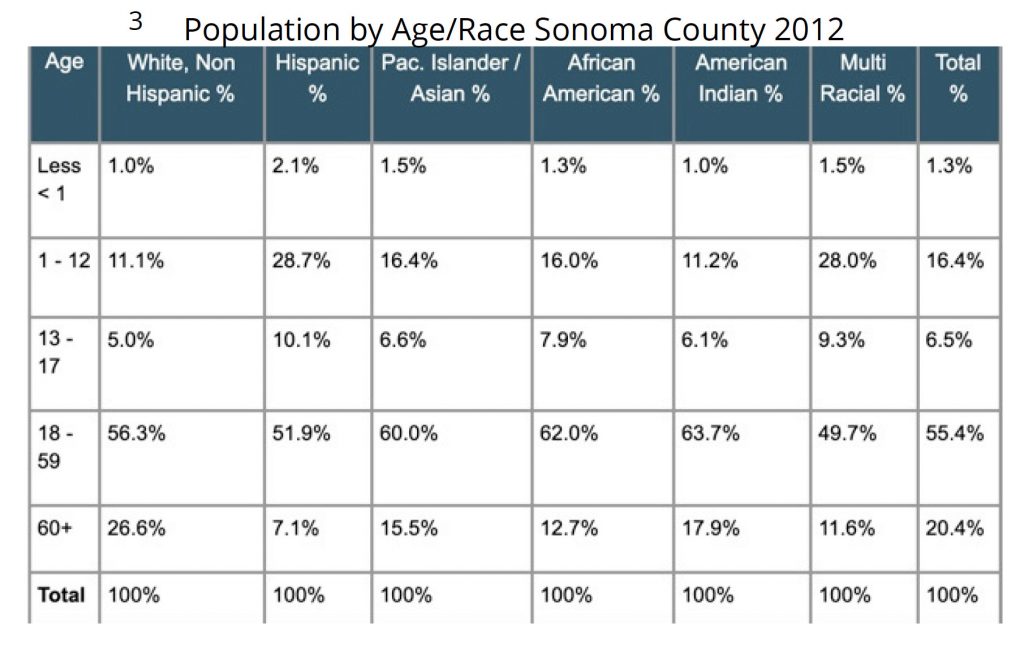
Part 1: General Demographics
Part 2: Poverty Statistics in Sonoma County
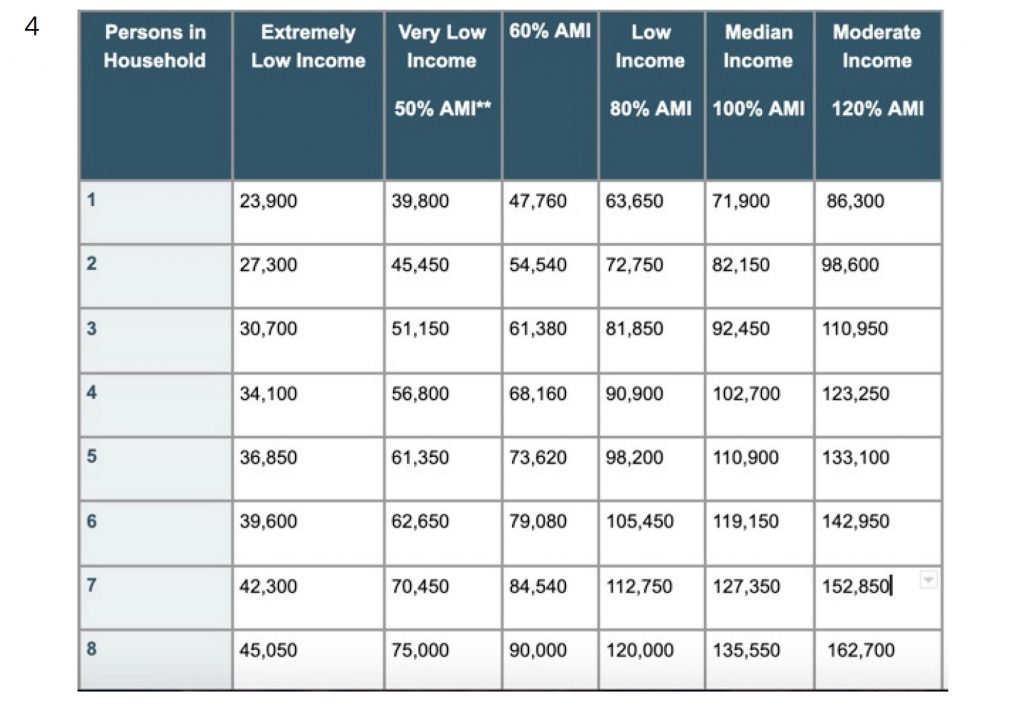
Income Limits in Sonoma County
*AMI= Area Median Income
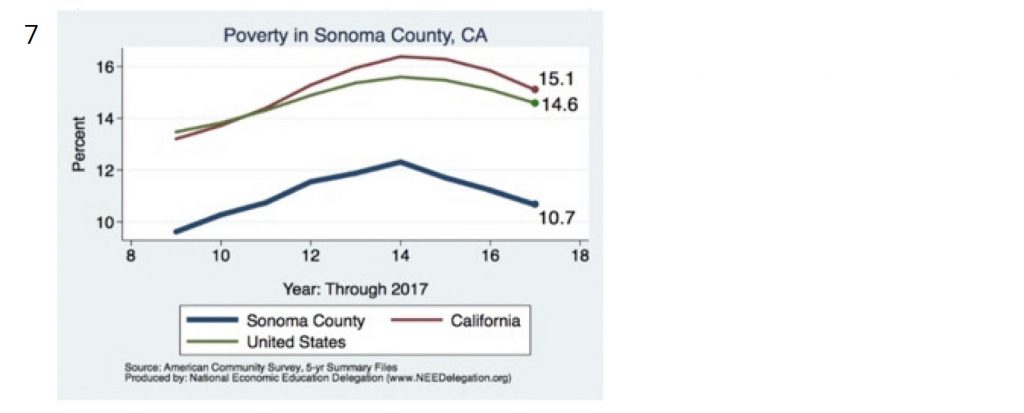
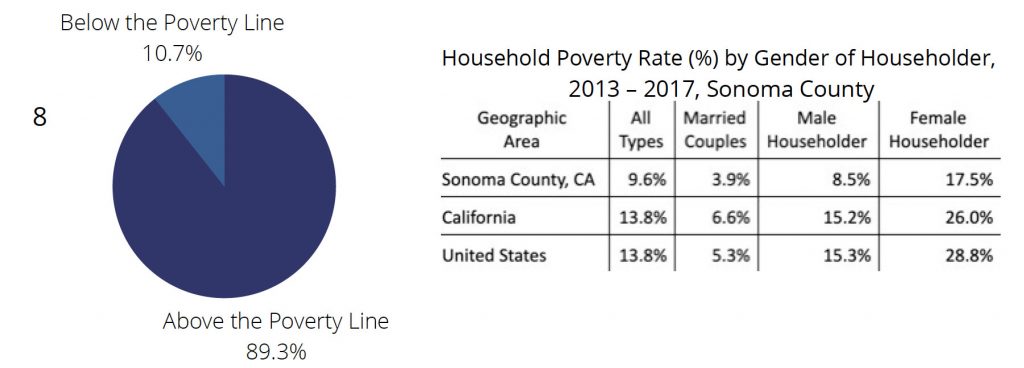
In 2017, it is estimated that 9.6 percent of all households were living in poverty for Sonoma County (the report area), compared to the national average of 13.8 percent (which is also California’s poverty rate as of 2017). Female-headed households are in poverty over double the rate of male-headed households. Individuals are different than households, as households may be one person or multiple people; a household in poverty is considered more grave an issue if there is more than one person, especially with children.
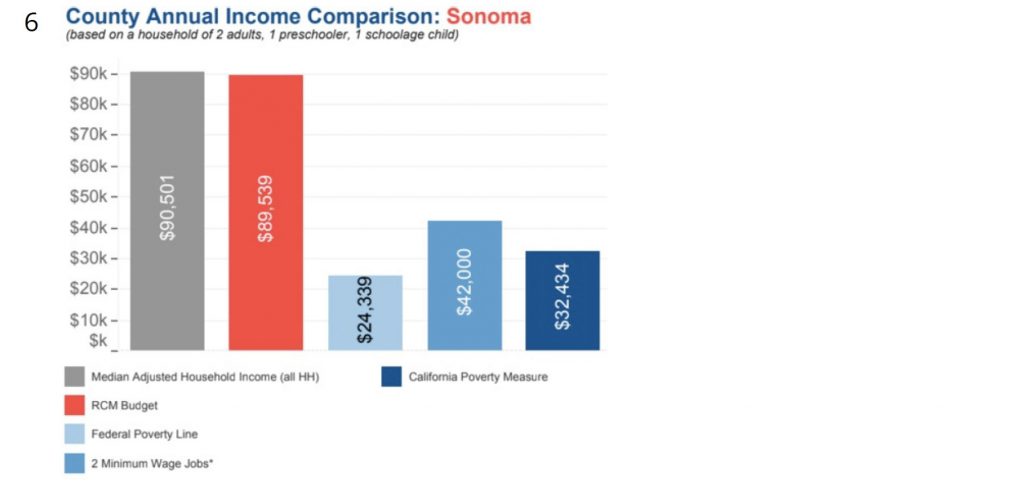
9. The Real Cost Measure in Sonoma
Households of color struggle disproportionately…
– Across the state, African Americans and Latinos have a disproportionate number of house holds with incomes below the Standard. In this area, of the 42,793 households below the Real CostMeasure, 14,282 are Latino. Families with children face a larger barrier to economic security.
– 52% of households with children under six struggle, a rate much greater than that of the rest of the county.
– Single mothers are most likely to struggle. 68% in the county are below the Real Cost Measure.
Families work, but don’t earn enough…
– 96% of households below RCM have at least one working adult.
– 74% of heads of household who work are employed full time and year round.
– A family of four (2 adults, one infant, one school age child) would need to hold more than 3 full time, minimum-wage jobs to achieve economic security.*High housing costs are a major challenge for struggling households…
– 40% of all households in the county spend more than 30% of their income on housing. (Source: United Way)
Part 3: Sources
- 1, California Department of Finance, 2018 Population Estimates, January 2019
- 2, California Department of Finance, 2018 Population Estimates, January 2019
- 3, California Dept. of Finance, E-5 Population and Housing Estimates for Cities, Counties, and the State (2011 – 2012)
- 4, https://sonomacounty.ca.gov/CDC/Housing-and-Neighborhood-Investment/Income-and- Rent-Limits/
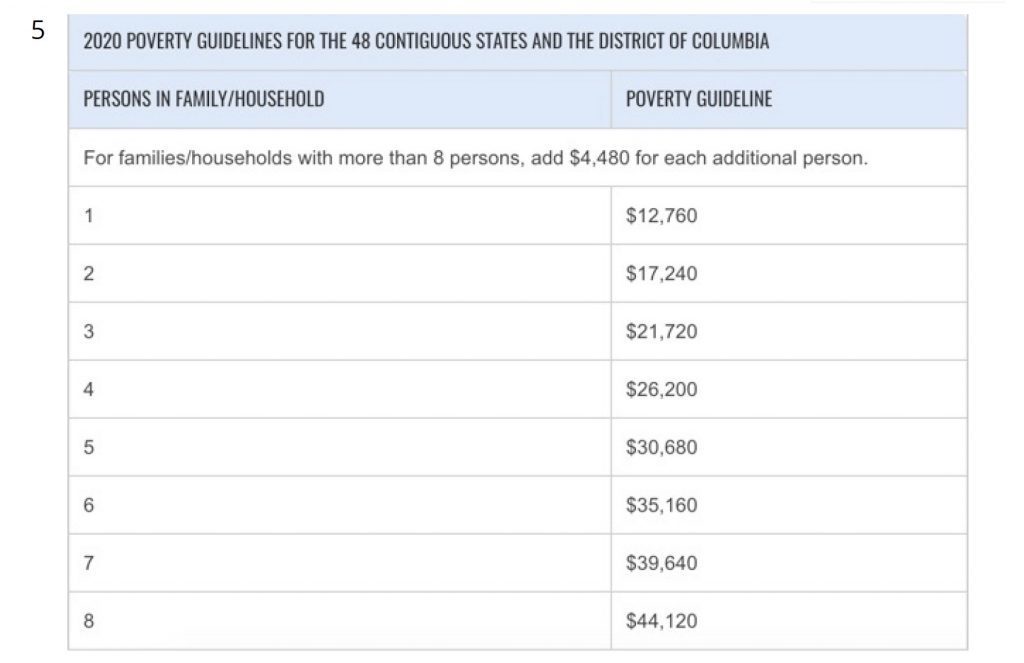
- 5, ASPE, Published January 17, 2020, https://aspe.hhs.gov/poverty-guidelines
- 6,9,United Ways of California in partnership with B3 Consults., http://www.unitedwaysca.org/realcost
- 8, U.S. Census Bureau, American Community Survey, 2017 Data Release, December 2018.